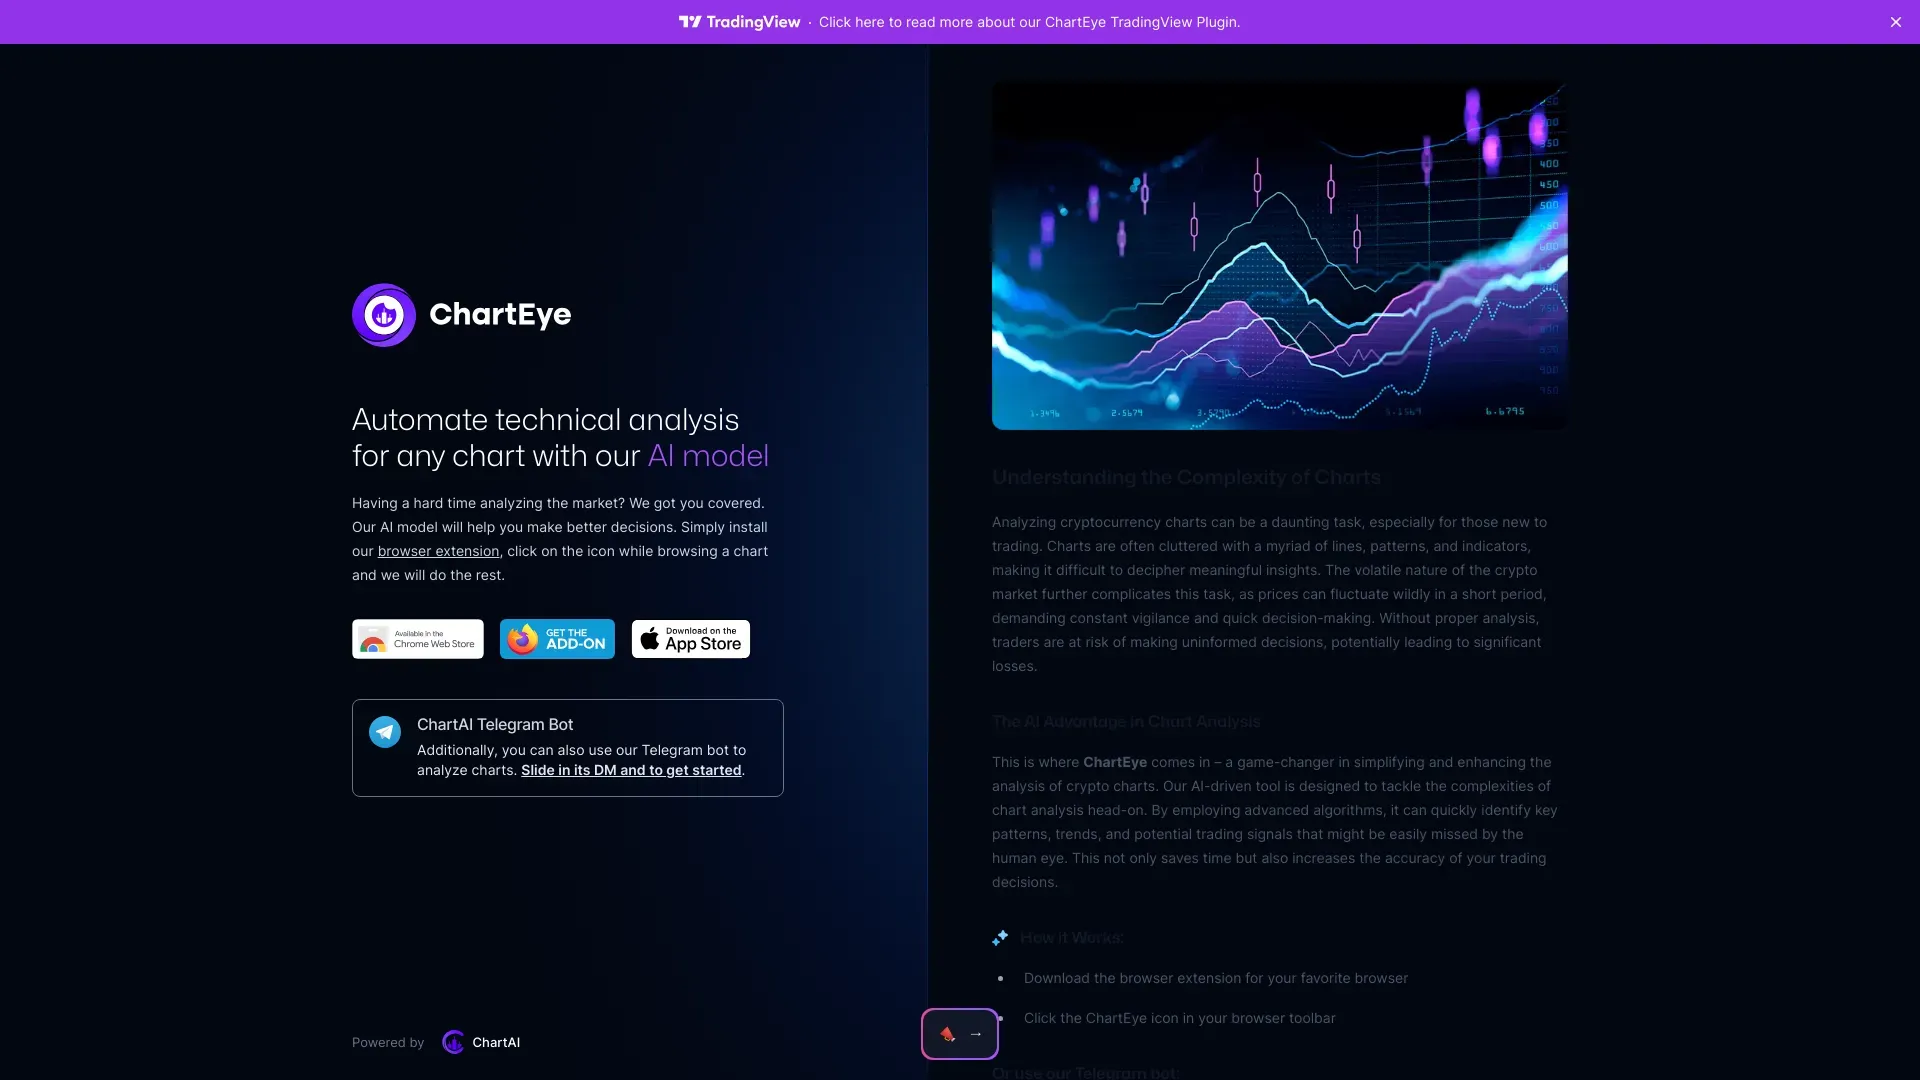
ChartEye
5
ADVERTISEMENT
-
Introduction:Technical Analysis powered by AI for each chart.
-
Category:Other
-
Added on:Apr 07 2024
-
Monthly Visitors:15.0K
-
Social & Email:—
ADVERTISEMENT
ChartEye: An Overview
ChartEye is an innovative tool that leverages artificial intelligence to produce comprehensive technical analysis reports for various charts with minimal user input. By streamlining the analysis process, ChartEye helps traders and investors quickly recognize key patterns, trends, and potential trading signals that may otherwise go unnoticed, ultimately optimizing their decision-making process.
ChartEye: Main Features
- AI-generated technical analysis reports
- Identification of key patterns, trends, and trading signals
- Time-saving capabilities for users
ChartEye: User Guide
- Download the ChartEye browser extension or access the Telegram bot.
- To initiate analysis, click on the ChartEye icon in your browser toolbar or type the TA command followed by the ticker symbol in the Telegram bot.
- Alternatively, you can upload your own chart image for a detailed analysis.
ChartEye: Pricing
ChartEye: User Reviews
- "ChartEye has transformed my trading approach. The insights are incredibly valuable and save me hours of manual analysis!" - Alex T.
- "The AI-driven reports are spot on. I've caught trends I would have missed without ChartEye." - Jamie L.
- "As a beginner, I find ChartEye easy to use, and it has significantly improved my understanding of market trends." - Sam R.
FAQ from ChartEye
Why might my chart evaluation be less comprehensive than I anticipated?
The depth of the evaluation is influenced by the intricacy and accuracy of the chart data provided. For more thorough insights, it's advisable to utilize charts that are well-defined and feature prominent indicators.
What kind of indicators enhance the analysis quality of a chart?
Incorporating a variety of technical indicators like moving averages, RSI, MACD, and Bollinger Bands will enrich the analysis, offering a more nuanced understanding of market conditions.
How can I ensure my submitted chart is appropriate for analysis?
To optimize compatibility, ensure your chart is legible and contains pertinent price and volume metrics. It's essential to steer clear of charts that have gaps or incomplete data.
What steps should I take if the analysis outcomes differ from my expectations?
ChartEye's evaluations are based on historical data and trends, and they cannot guarantee future results. If the findings are unsatisfactory, it might be beneficial to seek advice from a financial expert or perform additional evaluations.
Open Site
Latest Posts
More
-
 Discover 10 Groundbreaking AI Image Generators Transforming ArtistryThe integration of artificial intelligence (AI) into various technological domains has fundamentally shifted how we approach content creation. One of the most exciting applications of AI today is in image generation. These AI tools can create highly detailed and realistic images, offering countless possibilities for digital artists, marketers, and developers. Below is an extensive exploration of 10 innovative AI image generators that you need to try, complete with the latest data and user feedback.
 -
 7 Game-Changing AI Tools to Transform Your Business Operations in 2024In the fast-paced world of business, staying ahead of the competition demands cutting-edge technology and innovative solutions. As we approach 2024, the integration of Artificial Intelligence (AI) tools has become an indispensable strategy for enhancing efficiency, increasing profitability, and streamlining operations. This article will introduce seven top AI business tools that can significantly boost your business operations in the upcoming year.
 -
 Discover the Top AI Image Generators of 2024Artificial Intelligence (AI) continues to revolutionize various industries, including digital art and design. The advent of AI-powered image generators has opened up a world of possibilities for artists, designers, and content creators. These tools are not just for professionals; even hobbyists can now create stunning visuals with minimal effort. As we move into 2024, several AI image generators stand out with their advanced features, user-friendly interfaces, and impressive outputs. Here are our top picks for the best AI image generators of 2024, enriched with the latest data, expert insights, and real user reviews.
 -
 Top 8 AI Tools for Mastering Learning and EditingIn the fast-paced, digital-first world we live in, leveraging Artificial Intelligence (AI) tools has become crucial for enhancing learning and productivity. Whether you are a student trying to grasp complex concepts or a professional aiming to optimize your workflow, AI tools offer a myriad of features to help achieve your goals efficiently. Here, we present the best eight AI learning and editing tools for students and professionals, highlighting their unique features, user feedback, and practical applications.
 -
 Best 6 AI Marketing Tools to Skyrocket Your CampaignsIn the modern digital landscape, businesses continuously seek innovative methods to enhance their marketing campaigns and achieve substantial growth. The integration of artificial intelligence (AI) in marketing has revolutionized the way companies analyze data, understand their audience, and execute their strategies. Here, we explore the six best AI marketing tools that can dramatically elevate your marketing campaigns.
 -
 Top Speech-to-Text Apps for 2024As artificial intelligence (AI) continues to evolve, speech-to-text (STT) technology has seen significant advancements, streamlining various facets of both personal and professional communication. STT applications transform spoken language into written text, benefiting a wide range of users including journalists, business professionals, students, and individuals with disabilities. In this article, we will explore the top speech-to-text apps available in 2024, leveraging the latest data, features, and customer reviews to provide a comprehensive overview.


