


vizGPT
5
ADVERTISEMENT
-
Introduction:VizGPT is a tool that converts written content into dynamic visual charts.
-
Category:Image
-
Added on:May 15 2023
-
Monthly Visitors:1.0K
-
Social & Email:


ADVERTISEMENT
vizGPT: An Overview
vizGPT is an innovative data visualization platform that utilizes a chat interface to convert contextual data into dynamic visual charts. By employing advanced models such as chartGPT, vizGPT, text2viz, and text2chart, it effectively transforms textual input into meaningful visual representations, making data interpretation more accessible and engaging.
vizGPT: Main Features
- Contextual data visualization using natural language processing
- Interactive visual charts generated from advanced models
- Customization options for chart types, dimensions, colors, and labels
- Intuitive chat interface for seamless communication
- Real-time updates and adjustments to visualizations during conversations
vizGPT: User Guide
- Access the vizGPT platform and launch the chat interface.
- Input your contextual data into the chat box.
- Engage in conversation, allowing vizGPT to interpret your input.
- Receive interactive visualizations based on the provided textual information.
- Refine and customize visualizations by specifying your preferred chart types, dimensions, colors, and labels.
- Observe real-time updates as you continue the conversation to enhance the visual data representation.
vizGPT: User Reviews
- "vizGPT has revolutionized the way I present data. The ability to generate interactive charts from simple text is remarkable!" - Sarah T.
- "The chat interface is intuitive, and the real-time updates make it easy to tweak visualizations on the fly." - Mark J.
- "I've used vizGPT for analyzing business reports, and the insights it provides through visuals are invaluable." - Emily R.
FAQ from vizGPT
What kinds of graphical representations can VizGPT create?
VizGPT offers a diverse array of graphical representations such as bar graphs, line graphs, pie charts, scatter plots, and several others. The selection of the graphical format is determined by the data characteristics and the insights you intend to express.
Is it possible to alter the look of the visual graphs?
Absolutely! VizGPT provides options to modify the design of the visual graphs. You can adjust aspects like size, color schemes, and labels according to your specific needs and aesthetic preferences.
Can VizGPT provide visualizations that update in real-time?
Indeed, VizGPT is capable of delivering real-time visualizations. As you share new information or as the dialogue evolves, the visual outputs will automatically refresh to incorporate the most current data.
What types of data can be represented graphically by VizGPT?
VizGPT is versatile in visualizing a variety of data types, which include numerical figures, categorical data, and even textual information. It can analyze and convert contextual text into insightful visual formats.
Open Site
Latest Posts
More
-
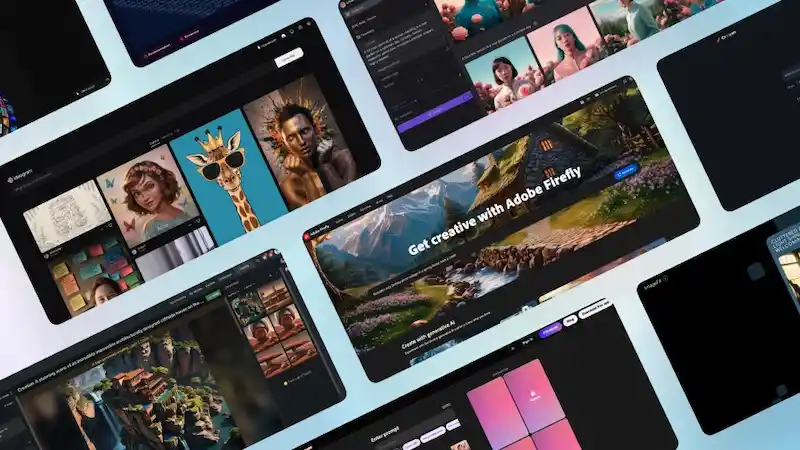
 Discover 10 Groundbreaking AI Image Generators Transforming ArtistryThe integration of artificial intelligence (AI) into various technological domains has fundamentally shifted how we approach content creation. One of the most exciting applications of AI today is in image generation. These AI tools can create highly detailed and realistic images, offering countless possibilities for digital artists, marketers, and developers. Below is an extensive exploration of 10 innovative AI image generators that you need to try, complete with the latest data and user feedback.
 -
7 Game-Changing AI Tools to Transform Your Business Operations in 2024In the fast-paced world of business, staying ahead of the competition demands cutting-edge technology and innovative solutions. As we approach 2024, the integration of Artificial Intelligence (AI) tools has become an indispensable strategy for enhancing efficiency, increasing profitability, and streamlining operations. This article will introduce seven top AI business tools that can significantly boost your business operations in the upcoming year.
-
Discover the Top AI Image Generators of 2024Artificial Intelligence (AI) continues to revolutionize various industries, including digital art and design. The advent of AI-powered image generators has opened up a world of possibilities for artists, designers, and content creators. These tools are not just for professionals; even hobbyists can now create stunning visuals with minimal effort. As we move into 2024, several AI image generators stand out with their advanced features, user-friendly interfaces, and impressive outputs. Here are our top picks for the best AI image generators of 2024, enriched with the latest data, expert insights, and real user reviews.
-
Top 8 AI Tools for Mastering Learning and EditingIn the fast-paced, digital-first world we live in, leveraging Artificial Intelligence (AI) tools has become crucial for enhancing learning and productivity. Whether you are a student trying to grasp complex concepts or a professional aiming to optimize your workflow, AI tools offer a myriad of features to help achieve your goals efficiently. Here, we present the best eight AI learning and editing tools for students and professionals, highlighting their unique features, user feedback, and practical applications.
-
Best 6 AI Marketing Tools to Skyrocket Your CampaignsIn the modern digital landscape, businesses continuously seek innovative methods to enhance their marketing campaigns and achieve substantial growth. The integration of artificial intelligence (AI) in marketing has revolutionized the way companies analyze data, understand their audience, and execute their strategies. Here, we explore the six best AI marketing tools that can dramatically elevate your marketing campaigns.
-
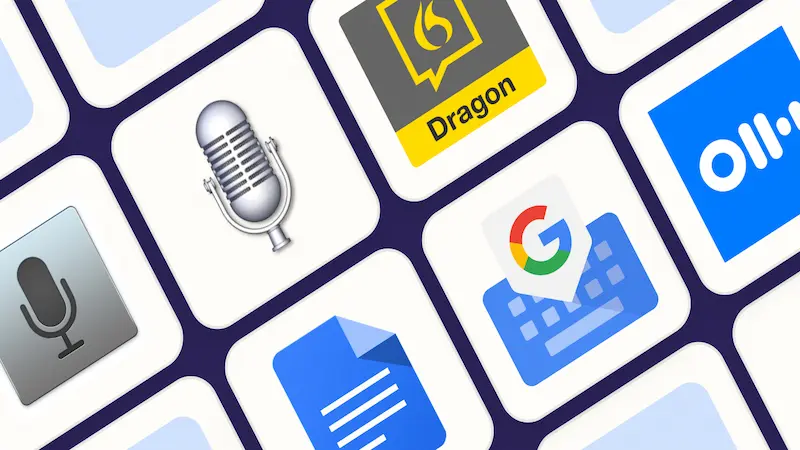
Top Speech-to-Text Apps for 2024As artificial intelligence (AI) continues to evolve, speech-to-text (STT) technology has seen significant advancements, streamlining various facets of both personal and professional communication. STT applications transform spoken language into written text, benefiting a wide range of users including journalists, business professionals, students, and individuals with disabilities. In this article, we will explore the top speech-to-text apps available in 2024, leveraging the latest data, features, and customer reviews to provide a comprehensive overview.