Spreadsite
5
ADVERTISEMENT
-
Introduction:Creation of dashboards powered by AI using spreadsheets.
-
Category:Design&Art
-
Added on:Aug 10 2024
-
Monthly Visitors:5.0K
-
Social & Email:
ADVERTISEMENT
Spreadsite: An Overview
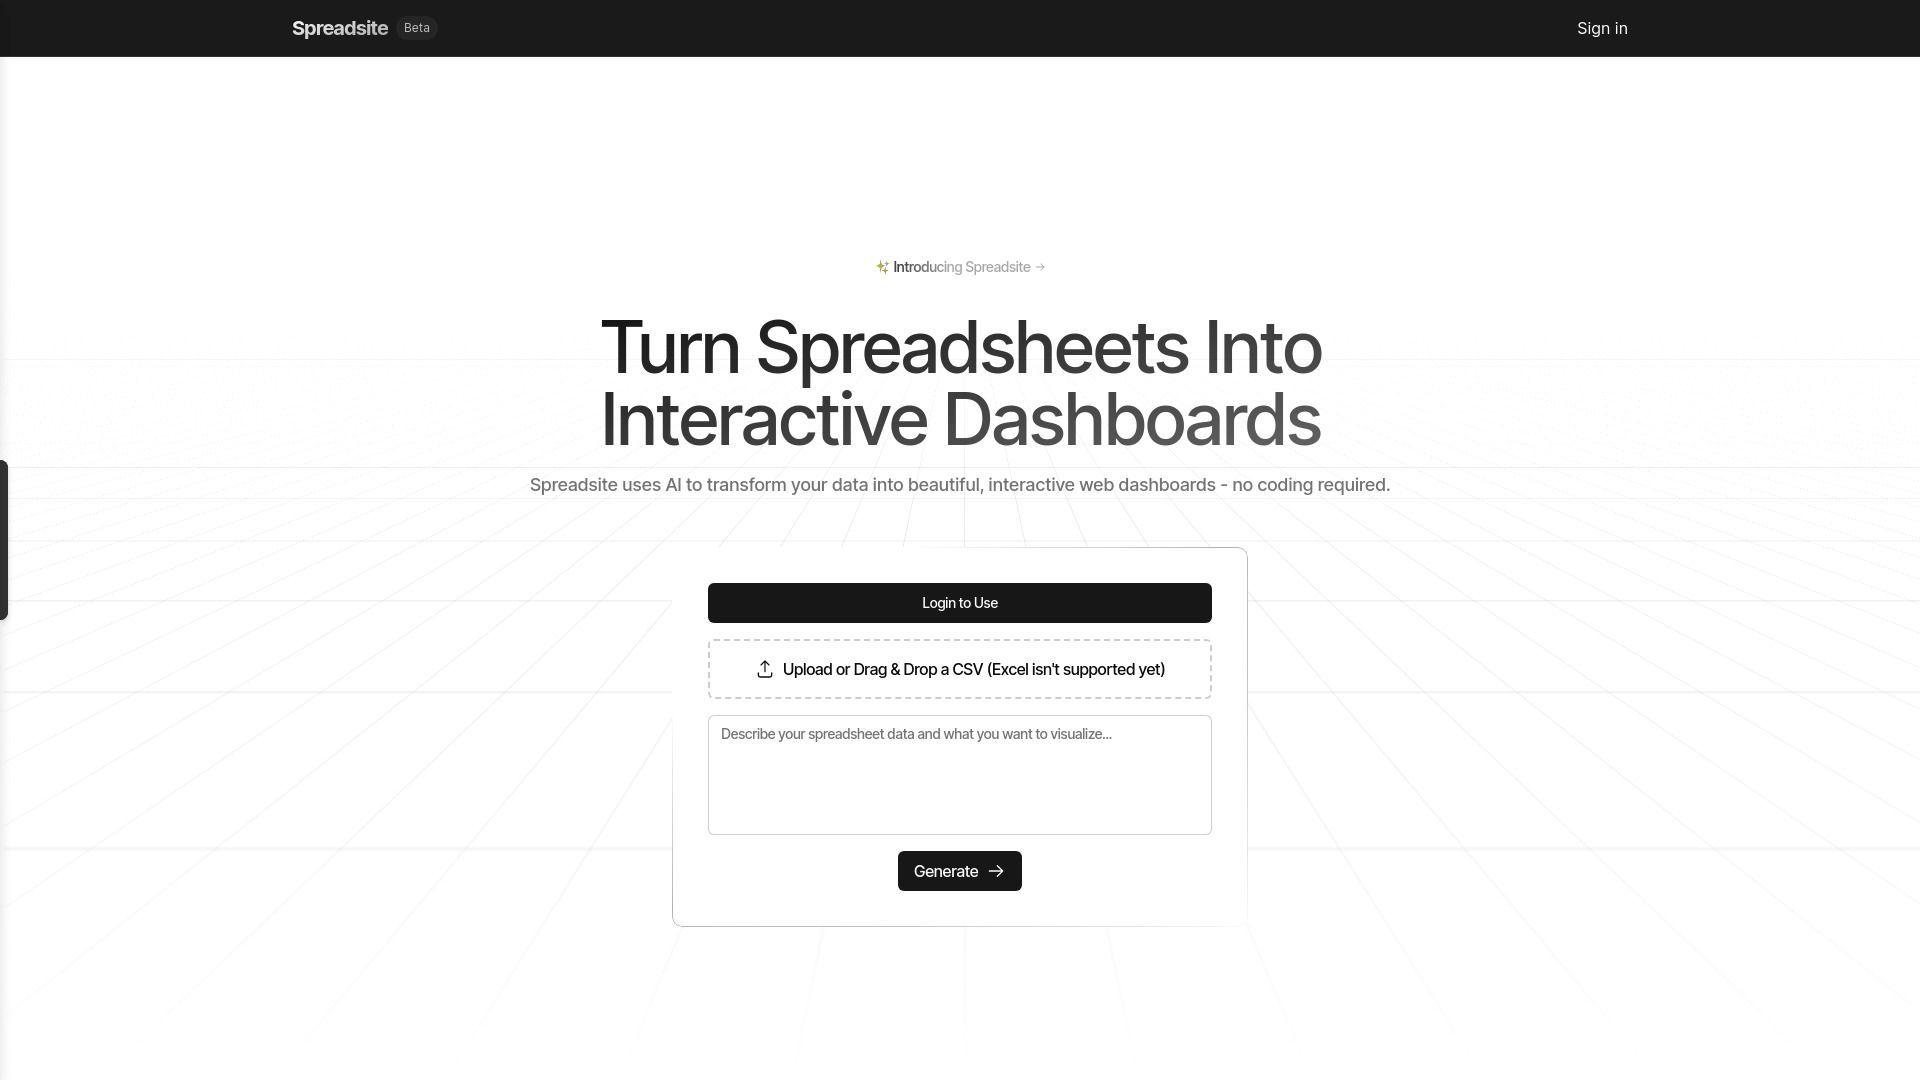
Spreadsite is an innovative platform that converts static spreadsheets into dynamic, AI-generated dashboards. It empowers users to visualize intricate data and disseminate insights with their teams via interactive web dashboards, enhancing data comprehension and collaboration.
Spreadsite: Main Features
- Transformation of spreadsheets into interactive web dashboards
- AI-powered data visualization tools
- Custom agent-driven workflows for streamlined processes
Spreadsite: User Guide
- Log in to the Spreadsite platform.
- Upload or drag & drop a CSV file into the interface.
- Allow the AI to process the data and generate a custom, interactive web dashboard.
- Explore the dashboard to visualize and analyze your data.
- Share insights and collaborate with your team using the dashboard features.
Spreadsite: Pricing
Spreadsite: User Reviews
- "Spreadsite has completely changed how I visualize data. The AI-generated dashboards are intuitive and easy to use!" - Jane D.
- "The ability to share insights with my team instantly has improved our productivity significantly. Highly recommend!" - Mark T.
- "I love how quickly I can convert my spreadsheets into interactive dashboards. It's a game-changer for my reports!" - Sarah L.
FAQ from Spreadsite
Can Spreadsite guarantee the confidentiality of my information?
Yes, Spreadsite prioritizes the protection of your data by implementing robust cleaning processes and tailored security measures specifically designed for enterprise-level clients.
Which data categories are most compatible with Spreadsite's features?
Spreadsite is versatile and excels with an array of data types, enabling users to craft dynamic dashboards for tracking everything from Olympic events to financial metrics, influencer interactions, renewable energy statistics, coffee sales trends, and polling analyses.
Open Site
Latest Posts
More
-
 Discover 10 Groundbreaking AI Image Generators Transforming ArtistryThe integration of artificial intelligence (AI) into various technological domains has fundamentally shifted how we approach content creation. One of the most exciting applications of AI today is in image generation. These AI tools can create highly detailed and realistic images, offering countless possibilities for digital artists, marketers, and developers. Below is an extensive exploration of 10 innovative AI image generators that you need to try, complete with the latest data and user feedback.
 -
 7 Game-Changing AI Tools to Transform Your Business Operations in 2024In the fast-paced world of business, staying ahead of the competition demands cutting-edge technology and innovative solutions. As we approach 2024, the integration of Artificial Intelligence (AI) tools has become an indispensable strategy for enhancing efficiency, increasing profitability, and streamlining operations. This article will introduce seven top AI business tools that can significantly boost your business operations in the upcoming year.
 -
 Discover the Top AI Image Generators of 2024Artificial Intelligence (AI) continues to revolutionize various industries, including digital art and design. The advent of AI-powered image generators has opened up a world of possibilities for artists, designers, and content creators. These tools are not just for professionals; even hobbyists can now create stunning visuals with minimal effort. As we move into 2024, several AI image generators stand out with their advanced features, user-friendly interfaces, and impressive outputs. Here are our top picks for the best AI image generators of 2024, enriched with the latest data, expert insights, and real user reviews.
 -
 Top 8 AI Tools for Mastering Learning and EditingIn the fast-paced, digital-first world we live in, leveraging Artificial Intelligence (AI) tools has become crucial for enhancing learning and productivity. Whether you are a student trying to grasp complex concepts or a professional aiming to optimize your workflow, AI tools offer a myriad of features to help achieve your goals efficiently. Here, we present the best eight AI learning and editing tools for students and professionals, highlighting their unique features, user feedback, and practical applications.
 -
 Best 6 AI Marketing Tools to Skyrocket Your CampaignsIn the modern digital landscape, businesses continuously seek innovative methods to enhance their marketing campaigns and achieve substantial growth. The integration of artificial intelligence (AI) in marketing has revolutionized the way companies analyze data, understand their audience, and execute their strategies. Here, we explore the six best AI marketing tools that can dramatically elevate your marketing campaigns.
 -
 Top Speech-to-Text Apps for 2024As artificial intelligence (AI) continues to evolve, speech-to-text (STT) technology has seen significant advancements, streamlining various facets of both personal and professional communication. STT applications transform spoken language into written text, benefiting a wide range of users including journalists, business professionals, students, and individuals with disabilities. In this article, we will explore the top speech-to-text apps available in 2024, leveraging the latest data, features, and customer reviews to provide a comprehensive overview.


