SimFin
5
ADVERTISEMENT
-
Introduction:SimFin is a reliable platform for sophisticated stock evaluation and financial analysis.
-
Category:Text&Writing
-
Added on:May 15 2023
-
Monthly Visitors:9.0K
-
Social & Email:
ADVERTISEMENT
SimFin: An Overview
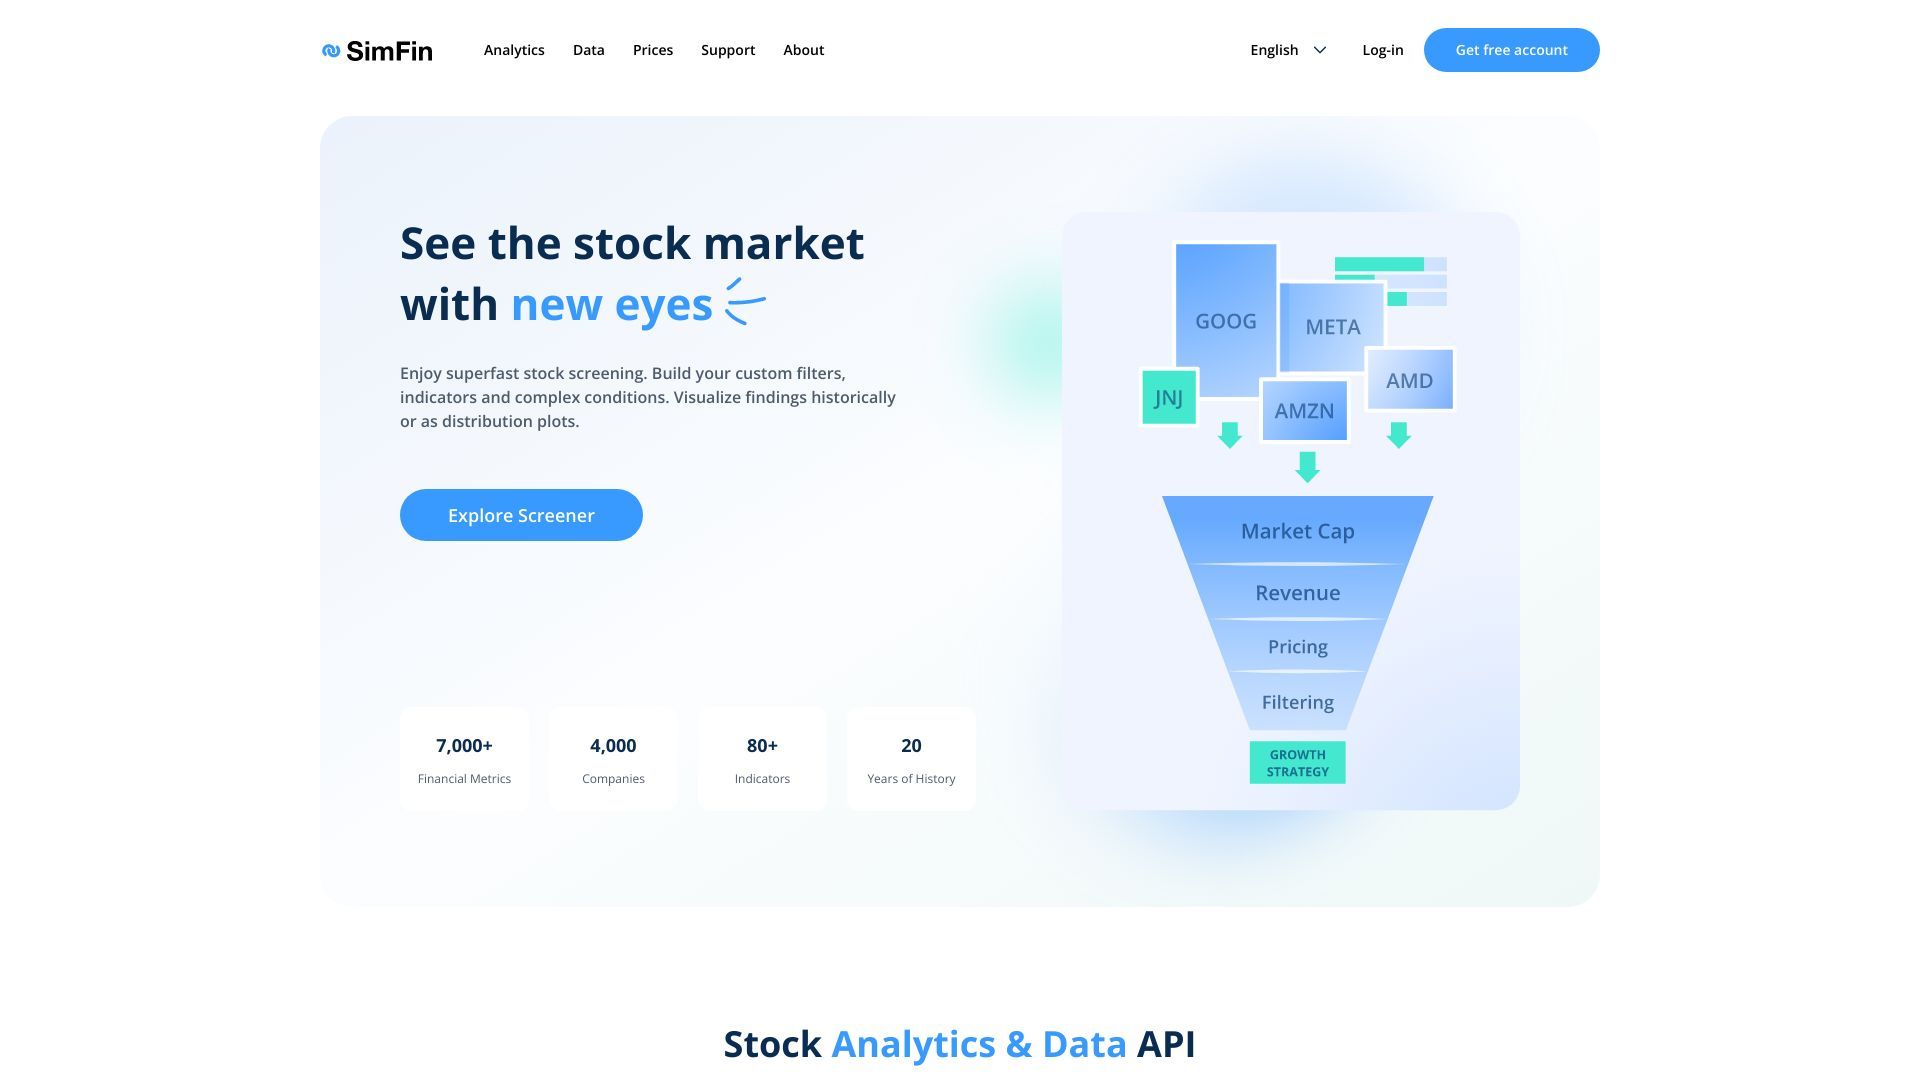
SimFin is a sophisticated stock analysis software and data download platform designed to empower users with robust financial insights through fundamental data and portfolio analysis. It caters to a variety of use cases, making it an essential tool for analysts looking to refine investment strategies, analyze market conditions, and optimize their portfolios.
SimFin: Main Features
- Stock screening with customizable filters, indicators, and complex conditions.
- Backtesting capabilities for individual stocks and intricate strategies.
- Financial data downloads available via API or bulk-CSV.
- Access to over 7,000 financial metrics from more than 5,000 companies.
- Visualization tools for stock market metrics, including line charts, distribution plots, and scatter plots.
- Comparison tools for line charts and scatter plots using custom metrics.
- Sharing capabilities for studies and strategies with other users.
- Integration with Python and Excel for advanced data analysis and predictive modeling.
SimFin: User Guide
- Sign up for a free account on the SimFin platform.
- Access the main features available in your account dashboard.
- Utilize the stock screening tool to create custom filters and indicators tailored to your investment objectives.
- Conduct backtesting on individual stocks or complex investment strategies to gauge performance.
- Download required financial data via the API or in bulk-CSV format for further analysis.
- Visualize stock market metrics using the provided charting tools for better insights.
- Compare different metrics and share your findings with others in the community.
- Leverage integration options with Python and Excel for enhanced analytical capabilities.
SimFin: User Reviews
- "SimFin has transformed the way I analyze stocks. The backtesting feature is particularly powerful and has helped me refine my investment strategies." - John D.
- "The ability to visualize metrics and share my findings with colleagues has made collaboration much smoother. Highly recommend it!" - Sarah M.
- "As a data analyst, the integration with Python has been a game changer for me. I can easily pull data and create predictive models." - Alex P.
- "I love the customizable stock screening options. They allow me to tailor my searches precisely to my investment criteria." - Lisa T.
FAQ from SimFin
What kinds of accounts does SimFin provide?
SimFin offers three distinct account types: a complimentary account, a BASIC account, and a PRO account. The complimentary account grants access to essential features, while the BASIC and PRO accounts come with enhanced data speeds and extra perks. For comprehensive details on pricing and features, please visit the Prices section of our website.
Who backs SimFin financially?
In 2022, SimFin successfully secured funding from IBG Risikokapitalfonds, which is overseen by bmp Ventures—an investment entity focused on nurturing innovative startups in Sachsen-Anhalt, Germany.
Why are there more stock listings from the US than from Europe on SimFin?
SimFin is in the process of broadening its database of public companies, with a goal to finalize the historical data for the US stock market by the end of Q1 2023. Listings for European markets are set to follow by the end of 2023, and Asian markets are expected to be completed by the end of 2024.
What is the function of a stock screener?
A stock screener serves as a valuable instrument for investors and analysts to sift through thousands of securities based on personalized criteria. The SimFin stock screener allows users to create intricate conditions using various indicators and values, enabling them to identify stocks that fit their investment strategies. Additionally, it offers visual representations of financial metrics and market distributions for deeper analysis.
Open Site
Latest Posts
More
-
 Discover 10 Groundbreaking AI Image Generators Transforming ArtistryThe integration of artificial intelligence (AI) into various technological domains has fundamentally shifted how we approach content creation. One of the most exciting applications of AI today is in image generation. These AI tools can create highly detailed and realistic images, offering countless possibilities for digital artists, marketers, and developers. Below is an extensive exploration of 10 innovative AI image generators that you need to try, complete with the latest data and user feedback.
 -
 7 Game-Changing AI Tools to Transform Your Business Operations in 2024In the fast-paced world of business, staying ahead of the competition demands cutting-edge technology and innovative solutions. As we approach 2024, the integration of Artificial Intelligence (AI) tools has become an indispensable strategy for enhancing efficiency, increasing profitability, and streamlining operations. This article will introduce seven top AI business tools that can significantly boost your business operations in the upcoming year.
 -
 Discover the Top AI Image Generators of 2024Artificial Intelligence (AI) continues to revolutionize various industries, including digital art and design. The advent of AI-powered image generators has opened up a world of possibilities for artists, designers, and content creators. These tools are not just for professionals; even hobbyists can now create stunning visuals with minimal effort. As we move into 2024, several AI image generators stand out with their advanced features, user-friendly interfaces, and impressive outputs. Here are our top picks for the best AI image generators of 2024, enriched with the latest data, expert insights, and real user reviews.
 -
 Top 8 AI Tools for Mastering Learning and EditingIn the fast-paced, digital-first world we live in, leveraging Artificial Intelligence (AI) tools has become crucial for enhancing learning and productivity. Whether you are a student trying to grasp complex concepts or a professional aiming to optimize your workflow, AI tools offer a myriad of features to help achieve your goals efficiently. Here, we present the best eight AI learning and editing tools for students and professionals, highlighting their unique features, user feedback, and practical applications.
 -
 Best 6 AI Marketing Tools to Skyrocket Your CampaignsIn the modern digital landscape, businesses continuously seek innovative methods to enhance their marketing campaigns and achieve substantial growth. The integration of artificial intelligence (AI) in marketing has revolutionized the way companies analyze data, understand their audience, and execute their strategies. Here, we explore the six best AI marketing tools that can dramatically elevate your marketing campaigns.
 -
 Top Speech-to-Text Apps for 2024As artificial intelligence (AI) continues to evolve, speech-to-text (STT) technology has seen significant advancements, streamlining various facets of both personal and professional communication. STT applications transform spoken language into written text, benefiting a wide range of users including journalists, business professionals, students, and individuals with disabilities. In this article, we will explore the top speech-to-text apps available in 2024, leveraging the latest data, features, and customer reviews to provide a comprehensive overview.


